Category:Supply and demand curves
Jump to navigation
Jump to search
economic model of price determination in microeconomics | |||||
| Upload media | |||||
| Instance of | |||||
|---|---|---|---|---|---|
| Facet of | |||||
| Has part(s) |
| ||||
| |||||
Subcategories
This category has the following 7 subcategories, out of 7 total.
A
C
- Cobweb model (13 F)
L
- Labour supply and demand curves (23 F)
P
- Price consumption curves (72 F)
S
T
Media in category "Supply and demand curves"
The following 155 files are in this category, out of 155 total.
-
A Price Ceiling Example - Rent Control.jpg 395 × 273; 100 KB
-
Aanbodcurve (deel).png 453 × 434; 3 KB
-
Afzetgrafiek concurrentie en monopolie leeg.png 583 × 392; 21 KB
-
Arbeitsangebot mit Endowment Income Effect.svg 439 × 427; 22 KB
-
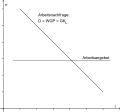
Arbeitsangebot und Arbeitsnachfrage Kompetitiv.svg 307 × 287; 35 KB
-
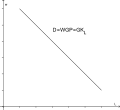
Arbeitsnachfrage Kompetitiv mit WGP.svg 416 × 383; 16 KB
-
Arbeitsnachfrage neoklassisch kompetitiver markt.png 552 × 384; 15 KB
-
Arbejdsmarked2.jpg 1,469 × 693; 53 KB
-
Arbejdsmarked3.jpg 1,489 × 693; 72 KB
-
Atomistische PAF.PNG 499 × 426; 5 KB
-
Basic supply demand th.png 300 × 300; 7 KB
-
Basic supply demand.png 300 × 300; 3 KB
-
Coase-Theorem Szenario 1.png 600 × 600; 21 KB
-
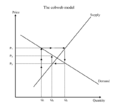
Cobweb theory.png 640 × 599; 47 KB
-
Combined Effect of Decreased Demand and Decreased Supply.jpg 390 × 368; 624 KB
-
Confronto Diagrammi di Carico mensili.jpg 2,962 × 1,566; 615 KB
-
Courbes d'offre et de demande pour un bien de Giffen.png 423 × 382; 17 KB
-
Curva de oferta.svg 550 × 550; 38 KB
-
Curve di domanda e offerta.png 596 × 410; 28 KB
-
Deadweightloss.jpg 427 × 395; 75 KB
-
Demand, Supply, and Market Equilibrium.pdf 1,275 × 1,650, 7 pages; 129 KB
-
Desplazamiento oferta.svg 450 × 450; 34 KB
-
Diagramma giornaliero di carico 09-06-2021.jpg 1,362 × 804; 67 KB
-
Discrete-supply-and-demand-he.svg 322 × 264; 18 KB
-
Domanda.png 271 × 190; 5 KB
-
Economics cobweb model2.png 373 × 376; 11 KB
-
Economics demand and supply curves.jpg 404 × 284; 104 KB
-
Economics supply curve.jpg 585 × 296; 118 KB
-
Ejemplo oferta y demanda.png 382 × 305; 10 KB
-
Eksempeloverskud.JPG 758 × 567; 36 KB
-
Eksportsub.jpg 884 × 628; 51 KB
-
Eksternalitet.JPG 861 × 624; 43 KB
-
Equilibrium.PNG 389 × 258; 6 KB
-
Eskaria eta eskaintzaren zergak.svg 369 × 315; 4 KB
-
European Wheat Prices - A Price Floor Example.jpg 390 × 347; 607 KB
-
External benefit diagram.jpg 425 × 363; 32 KB
-
Factors That Shift Demand Curves.jpg 780 × 243; 129 KB
-
Factors That Shift Supply Curves.jpg 780 × 240; 109 KB
-
Fig5 Supply and demand curves.jpg 221 × 203; 9 KB
-
Framboð, eftirspurn og velferð.png 2,142 × 2,000; 88 KB
-
Geknickte PAF.PNG 499 × 426; 7 KB
-
Geschenkökonomie.svg 697 × 504; 5 KB
-
Gleichgewicht.jpg 1,024 × 768; 73 KB
-
Gleichgewichtspreis.svg 460 × 430; 17 KB
-
Gm gleichgewicht mikro veraenderung.jpg 1,024 × 768; 87 KB
-
Gm gleichgewicht mikro2.jpg 1,024 × 768; 71 KB
-
Haucap Grundlagen von Angebot und Nachfrage.webm 54 min 21 s, 960 × 480; 366.64 MB
-
HouCompositeFirmMarketSD.png 700 × 500; 74 KB
-
Impact of minimum wage in monopsonistic setting.svg 409 × 241; 82 KB
-
Increasing Costs Leads to Increasing Price.jpg 390 × 236; 608 KB
-
Ineffective Price Floor.svg 400 × 400; 7 KB
-
Inferieurcrop.png 783 × 457; 17 KB
-
Inkomensel1cropped.png 795 × 470; 11 KB
-
Inkomenselcrop.png 728 × 543; 21 KB
-
Inkomenselcrop2.png 728 × 543; 21 KB
-
Internalisierung externer Effekte.png 1,322 × 767; 138 KB
-
Internalisierung externer Effekte.svg 463 × 376; 13 KB
-
Jevons Paradox.jpg 680 × 540; 28 KB
-
Jämvikt.png 515 × 416; 9 KB
-
Jämviktspris.svg 494 × 448; 15 KB
-
Kinked demand.svg 580 × 480; 2 KB
-
Kompetitiver Arbeitsmarkt Ungleichgewicht.svg 425 × 435; 84 KB
-
Kompetitiver Arbeitsmarkt.svg 439 × 427; 42 KB
-
Krzywa podaży-przesunięcie krzywej.svg 729 × 548; 10 KB
-
Krzywa podaży-przesunięcie po krzywej.svg 729 × 548; 12 KB
-
Krzywa podaży.svg 729 × 548; 11 KB
-
Krzywa popytu-przesunięcie krzywej.svg 729 × 548; 11 KB
-
Krzywa popytu-przesunięcie po krzywej.svg 729 × 548; 13 KB
-
Krzywa popytu.svg 729 × 548; 11 KB
-
Ley de la oferta y la demanda.png 340 × 216; 3 KB
-
Lrindustrysupplycurve.jpg 495 × 355; 85 KB
-
Luxegcrop.png 504 × 397; 6 KB
-
Marshall criteriumcropped.png 461 × 310; 7 KB
-
Monopoly graph.jpg 1,080 × 1,079; 287 KB
-
Negative externality.svg 640 × 480; 19 KB
-
Noodzgcrop.png 444 × 339; 5 KB
-
Nyligevgt.JPG 888 × 663; 42 KB
-
Offre et demande relative mondiale.JPG 685 × 599; 28 KB
-
Offre-demande-equilibre.svg 217 × 217; 6 KB
-
Okonlangsigt.JPG 785 × 737; 40 KB
-
Oversupply price to eql.png 343 × 281; 6 KB
-
PAF.PNG 512 × 384; 5 KB
-
PAF2.PNG 512 × 384; 6 KB
-
Pcindustrysupplycurve.jpg 798 × 340; 93 KB
-
Positive externality.svg 640 × 480; 18 KB
-
Price ceiling.png 266 × 219; 6 KB
-
Price Ceiling.png 1,106 × 894; 90 KB
-
Price of market balance mk.svg 312 × 277; 11 KB
-
Price of market balance-he.svg 510 × 500; 53 KB
-
Price of market balance.gif 512 × 512; 12 KB
-
Price of market balance.svg 312 × 277; 11 KB
-
Profitmaksmarkedslang.JPG 801 × 548; 22 KB
-
Qv=-2p+10.png 545 × 503; 11 KB
-
ScanLebensmittel.jpg 521 × 687; 55 KB
-
ScanTextil.jpg 503 × 661; 55 KB
-
SD-Hou.GIF 418 × 392; 5 KB
-
SD2-Hou.gif 421 × 403; 7 KB
-
SD3-Hou.gif 423 × 406; 9 KB
-
Setting Prices.jpg 390 × 240; 592 KB
-
Shifts in Demand - A Car Example.jpg 534 × 342; 98 KB
-
Shifts in Supply - A Car Example.jpg 585 × 352; 104 KB
-
Simple supply and demand.svg 629 × 497; 8 KB
-
Sınıq (2).png 481 × 351; 49 KB
-
Sommaorizzontale.gif 451 × 142; 3 KB
-
Stigningfaldikurve.JPG 912 × 615; 38 KB
-
Sup and dmd1.jpg 514 × 307; 65 KB
-
Supply and Demand curve.png 1,590 × 1,156; 177 KB
-
Supply and demand curves.svg 300 × 300; 1 KB
-
Supply and demand.jpg 382 × 359; 11 KB
-
Supply and demand.png 698 × 480; 18 KB
-
Supply and demand.svg 600 × 600; 10 KB
-
Supply and Demand.svg 512 × 381; 9 KB
-
Supply and demand2.jpg 720 × 616; 110 KB
-
Supply Curve Shifts.jpg 390 × 237; 610 KB
-
Supply Curve.jpg 390 × 238; 578 KB
-
Supply Demand example 01.svg 530 × 460; 12 KB
-
Supply Demand example 02.svg 530 × 460; 18 KB
-
Supply demand.jpg 627 × 516; 24 KB
-
Supply Demand.png 309 × 244; 4 KB
-
Supply-and-demand mk.svg 530 × 530; 18 KB
-
Supply-and-demand.svg 500 × 500; 13 KB
-
Supply-demand-equilibrium jp.svg 217 × 217; 24 KB
-
Supply-demand-equilibrium-cs.svg 217 × 217; 8 KB
-
Supply-demand-equilibrium-he.svg 217 × 217; 23 KB
-
Supply-demand-equilibrium-th.svg 217 × 217; 9 KB
-
Supply-demand-equilibrium.svg 217 × 217; 10 KB
-
Supply-demand-P.png 617 × 557; 7 KB
-
Supply-demand-right-shift-demand mk.svg 227 × 227; 28 KB
-
Supply-demand-right-shift-demand zh-tw.svg 217 × 217; 11 KB
-
Supply-demand-right-shift-demand-eu.svg 217 × 217; 11 KB
-
Supply-demand-right-shift-demand-he.svg 217 × 217; 17 KB
-
Supply-demand-right-shift-demand.svg 217 × 217; 11 KB
-
Supply-demand-right-shift-supply-de.svg 217 × 217; 12 KB
-
Supply-demand-right-shift-supply-he.svg 217 × 217; 17 KB
-
Supply-demand-right-shift-supply.png 217 × 217; 10 KB
-
Supply-demand-right-shift-supply.svg 217 × 217; 11 KB
-
Supply.gif 195 × 183; 2 KB
-
Supplycurveshift.gif 292 × 220; 3 KB
-
Vertical supply.png 328 × 256; 3 KB
-
Vertical-supply-left-shift-demand mk.svg 227 × 227; 12 KB
-
Vertical-supply-left-shift-demand-he.svg 217 × 217; 18 KB
-
Vertical-supply-left-shift-demand.png 217 × 217; 8 KB
-
Vertical-supply-left-shift-demand.svg 217 × 217; 12 KB
-
Vraag en aanbod.jpg 1,240 × 1,111; 97 KB
-
Vraagenaanbod.png 335 × 273; 8 KB
-
VWL Arbeitsmarkt AundN.gif 483 × 366; 11 KB
-
WIKI pic 3.png 644 × 531; 76 KB
-
Попит-пропозиція.svg 219 × 221; 16 KB
-
Снижение предложения.jpg 686 × 568; 45 KB
-
Снижение спроса.jpg 686 × 568; 47 KB
-
עקומת הביקוש.jpg 1,123 × 521; 49 KB
-
চাহিদা রেখা.JPG 538 × 487; 10 KB


.png/120px-Aanbodcurve_(deel).png)


















.png/120px-Sınıq_(2).png)


